
Analyze network traffic: Capture, read and fix Problems
Learn how to analyze network traffic step by step: capture data, build a baseline, read encrypted flows and spot security or performance problems.
Published November 20, 2026

It's 2:10 on a Tuesday and the front desk has called twice about slow WiFi. Nothing was changed overnight. The access points are up, the uplink graph looks much like yesterday, and the provider says the circuit is clean. You have about twenty minutes before someone decides the network team owns the problem.
That twenty minutes is what traffic analysis is for. Not collecting every packet, but proving a small set of things quickly: whether the link is full, whether one device is misbehaving, whether something inside is talking to a host it shouldn't, or whether the complaint is really about coverage in one corner of a building.
The order matters. Get the metrics right, take a capture that answers one question, build a baseline you can compare against, and keep records you'd be comfortable defending.
Table of Contents
- Traffic Metrics to Watch and What They Mean
- How to Capture Traffic Step by Step
- Building a Baseline for Normal Traffic
- Reading Traffic When It Is Encrypted
- Spotting Security and Performance Problems
- Keeping Evidence Without Over-Collecting Data
- Choose Your First Monitoring Setup
Traffic metrics to watch and what they Mean
Slow WiFi at 2 pm rarely means the network broke. It usually means one of three things: demand peaked, a single device started doing something unusual, or a host on the network began talking to somewhere it shouldn't. You can separate those possibilities with a handful of numbers you probably already collect.
The device population makes this harder than it used to be. Cisco's 2017 to 2022 forecast projected that fixed and WiFi traffic would reach 51% of total IP traffic by 2022, up from 43% in 2017, and that non-PC devices would generate 81% of global IP traffic (Cisco global connections forecast). Cell phones, smart TVs, registers, and building controllers now carry most of the volume, and none of them appear in an asset register.
| Metric | What it reveals | Warning sign |
|---|---|---|
| Link utilization | How full a link is over time | Sustained above 70-80% of capacity |
| Top talkers | Hosts or SSIDs using the most volume | One device using a disproportionate share |
| Protocol and port mix | Whether traffic matches the services you expect | Unexpected ports or protocols at scale |
| DNS query volume | Lookup activity per host | Sudden spikes or repeated lookups of one domain |
| NXDOMAIN share | Failed name lookups | Rising share, often malware or misconfiguration |
| New connections per minute | Session creation rate | Sharp rise suggesting scanning or flooding |
| Retransmissions | Lost or repeated packets | Above 1-2% of packets |
| Latency and jitter | Delay and how much it varies | Jitter that breaks voice or video calls |
Read that list as triage order, not a scorecard. At 2 pm, start with link utilization for the hour and compare it against the same hour on ordinary weeks. If utilization sits at its usual peak and retransmissions are normal, the cause is capacity, and the fix is scheduling, shaping or more bandwidth rather than a hunt for malware.
If utilization is unremarkable and one device dominates the top talkers, that device is your next check, not the uplink. If retransmissions climb while utilization stays flat, stop reading traffic and start inspecting infrastructure: a failing cable, a duplex mismatch, or an access point fighting interference on a congested channel.
The rule that ends arguments: no single reading proves anything. A number only means something against the same site's normal range at the same hour.
How to capture traffic Step by Step
The aim is a representative sample, not a copy of the network. Twenty minutes taken at the right moment beats a week of files nobody opens, and it stays small enough to hand to a colleague.
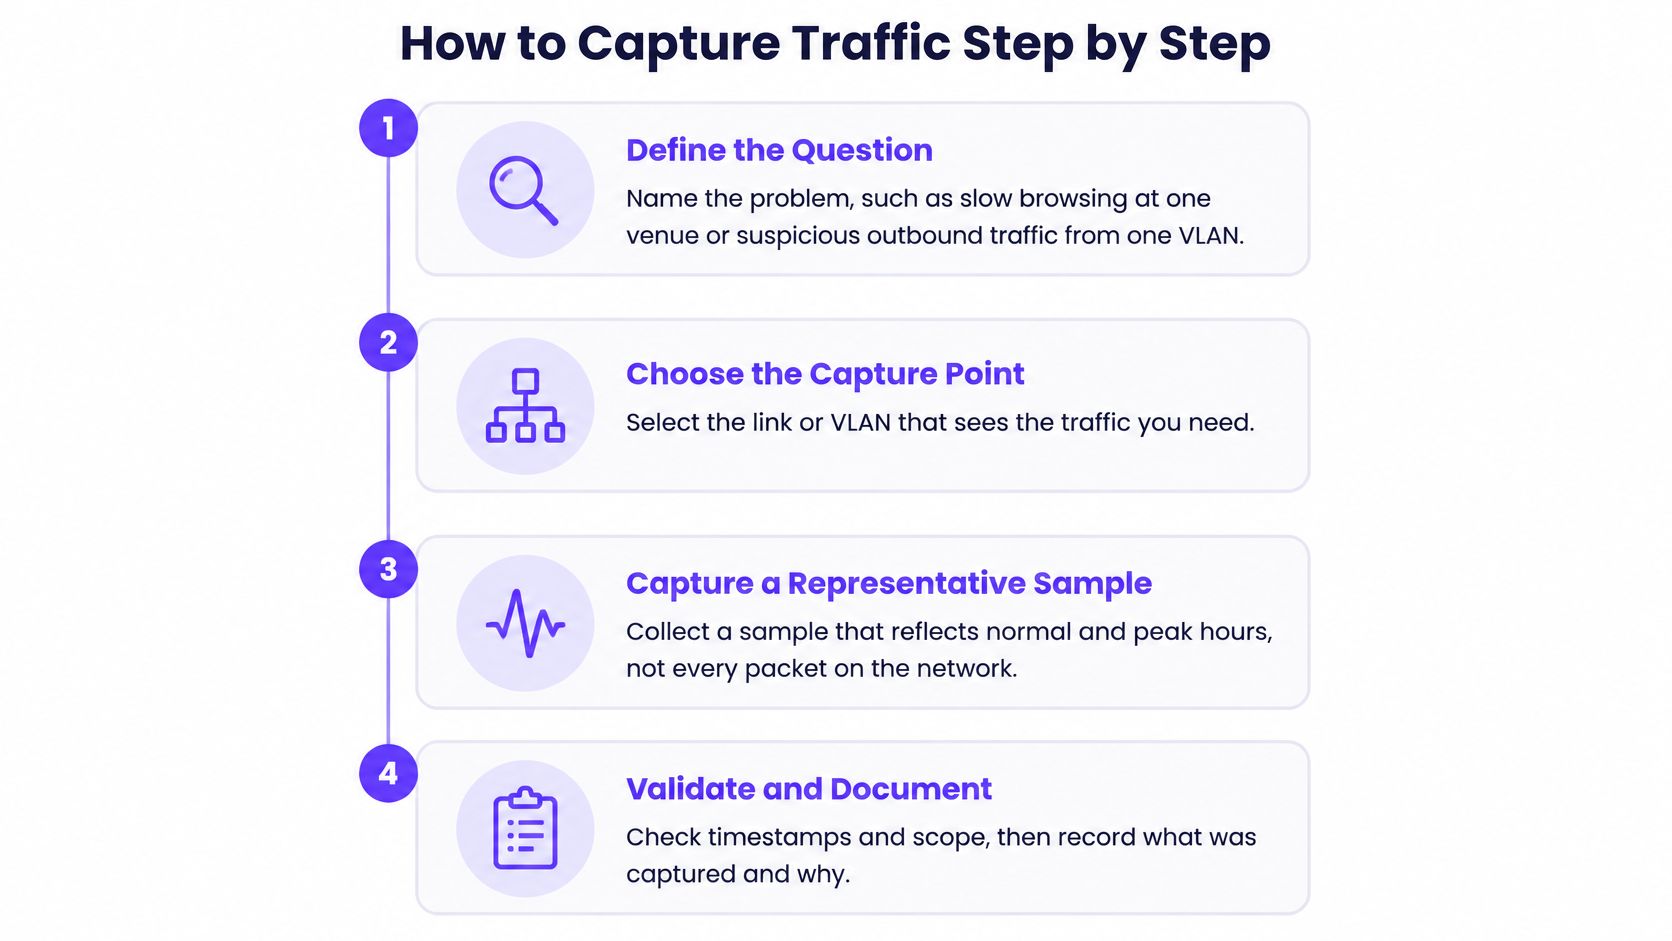
Define the question. "Slow browsing on the guest SSID at one venue" and "unexpected outbound traffic from the payment VLAN" need different capture points, filters and durations. Write the question down before you log into a switch. The common mistake is capturing first and hoping the question shows up in the file.
Choose a point that sees both directions. A SPAN port on the switch, an inline TAP on the uplink, or flow export from the router or firewall. Flow export is the cheapest way to watch a site continuously, and packet capture is what you reach for when flows show something odd. Mirroring a port that carries only one direction gives you half a conversation and a retransmission count that means nothing.
Filter before you record. Scope the capture to one subnet, VLAN or host. That keeps the file small enough to open in seconds and stops you collecting traffic from staff and guests who aren't part of the problem.
Capture a fixed window. Fifteen to thirty minutes during the busy hour, then a shorter capture during a quiet period. The pair makes comparison possible later; a single capture is an anecdote.
Put the site, date and time in the file name. This feels trivial until you're holding forty captures and can't tell which venue called.
Read with display filters, not by scrolling. Start with Protocol Hierarchy and Conversations to see what's present, then narrow in on retransmissions or name lookups. Scrolling a busy capture by hand is how people conclude there's nothing wrong.
Record the context alongside the file. Capture point, filter, timing, what users reported, and what you already ruled out.
One habit makes the data usable later. Normalize flows by interface, SSID or VLAN, site, time window and direction, and account for NAT, asymmetric routing, tunneling and shared devices before you set any threshold (Vectra's guide to encrypted traffic analysis). Network context isn't noise around the analysis, it's part of it.
If you want the whole routine on one page for the team, this is the sequence:
| Capture point | Best for | Trade-off |
|---|---|---|
| SPAN or mirror port | Packet capture of one port or VLAN | Sees only mirrored traffic and can miss one direction |
| Network TAP | Full packet capture on a single link | Dedicated hardware; captures both directions reliably |
| Flow export (NetFlow, sFlow, IPFIX) | Long-term monitoring from router or firewall | Cheapest; keeps flow summaries, not packets |
Building a baseline for normal traffic
A number becomes a signal only when you know what that number usually is. Baselines get skipped because they're dull, and the cost arrives later as an alert queue everyone mutes.
Watching totals live is the easy half. Knowing which totals are wrong for this hour on this site is the other half.
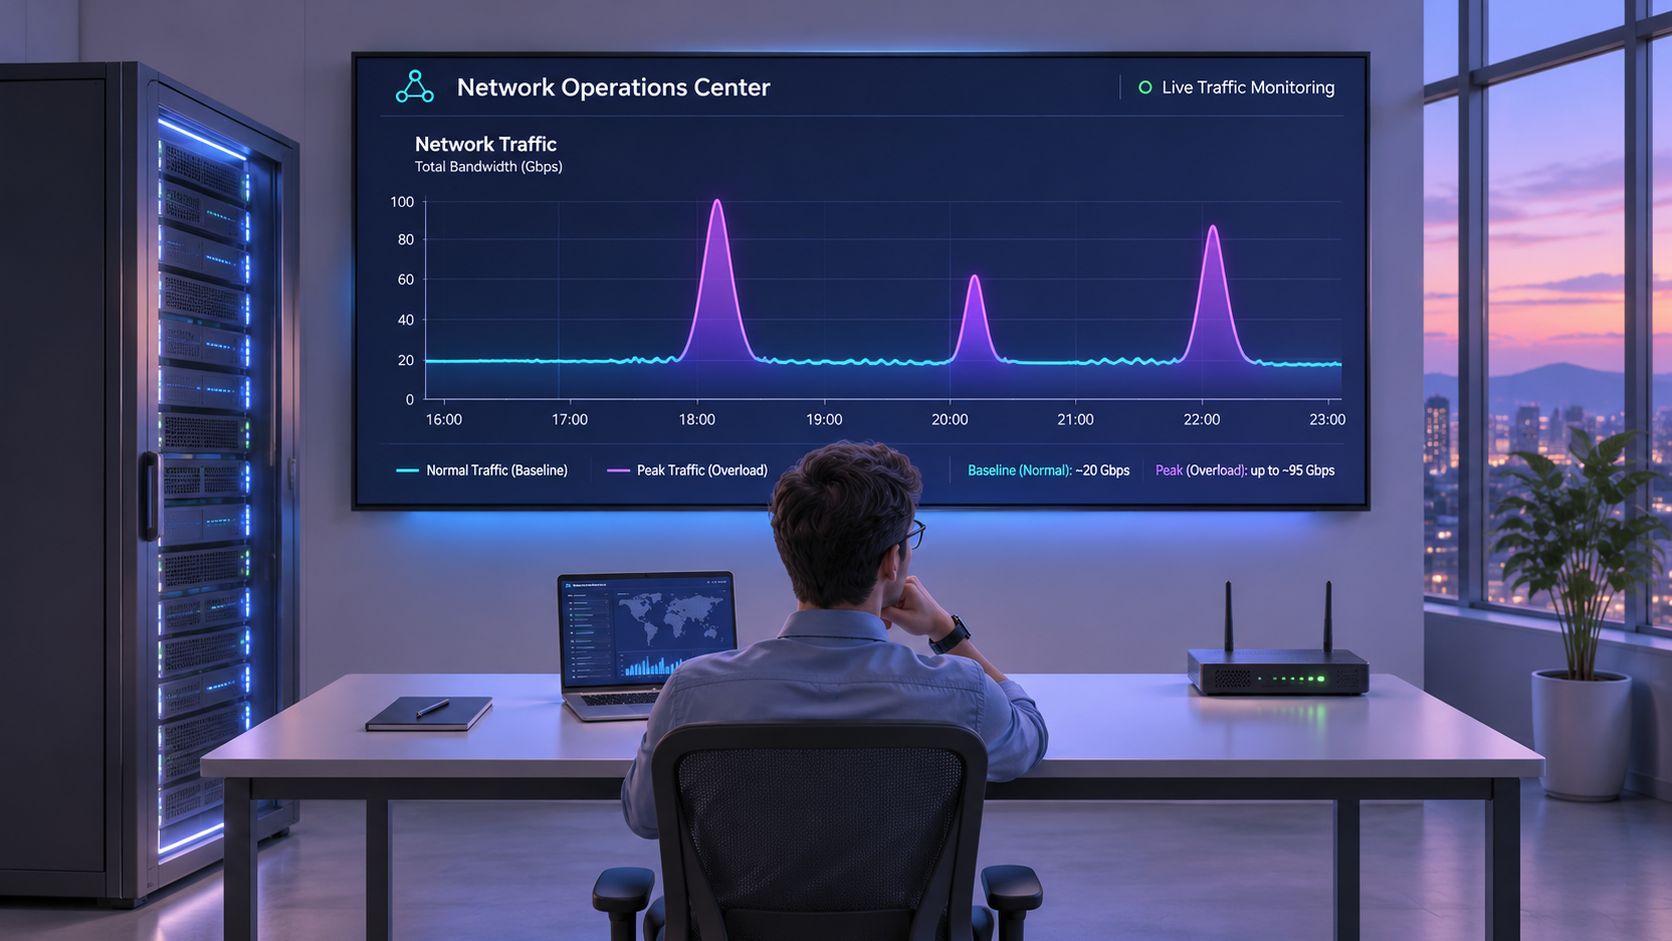
Growth makes any baseline perishable. Cisco's forecast projected worldwide IP traffic climbing from 122.4 exabytes per month in 2017 to 396.0 exabytes per month in 2022, a 26% compound annual growth rate, and put busy-hour traffic at about 7.2 petabits per second against an average near 1 petabit per second (Cisco Global IP Traffic Forecast). The gap between average and peak is the part that breaks links.
The climb hasn't settled. Cloudflare Radar measured 17.2% growth in global Internet traffic during 2024 (Cloudflare Radar 2024 in review), which is enough to make a two-year-old baseline describe a network that no longer exists.
What to record each hour
- Volume per SSID and VLAN, not just per uplink, because a flat uplink hides the segment that grew.
- DNS query rate and NXDOMAIN share, measured per thousand lookups so the ratio survives traffic growth.
- Top destinations and new connections per minute, kept against the hour of the week rather than the day.
- Schedule context, so school semesters, event nights, and weekend hotel patterns are labeled instead of treated as anomalies.
Build across at least two weeks, covering weekday and weekend behavior and both busy and quiet hours. Set thresholds per hour of the week, so a Friday evening peak at a hotel doesn't raise an incident every seven days.
Three consecutive days outside the band for the same hour is worth investigating. One outlier is usually a match stream, a software rollout or a conference keynote, and it belongs in the notes rather than in an escalation.
Reading traffic when it is encrypted
TLS 1.3, QUIC on UDP/443, HTTP/3, VPNs and encrypted DNS have moved most payloads out of reach. Any plan built on reading page content is now a plan to disappoint the person who asked for it.
The dashboard is still useful. It answers different questions than it used to.
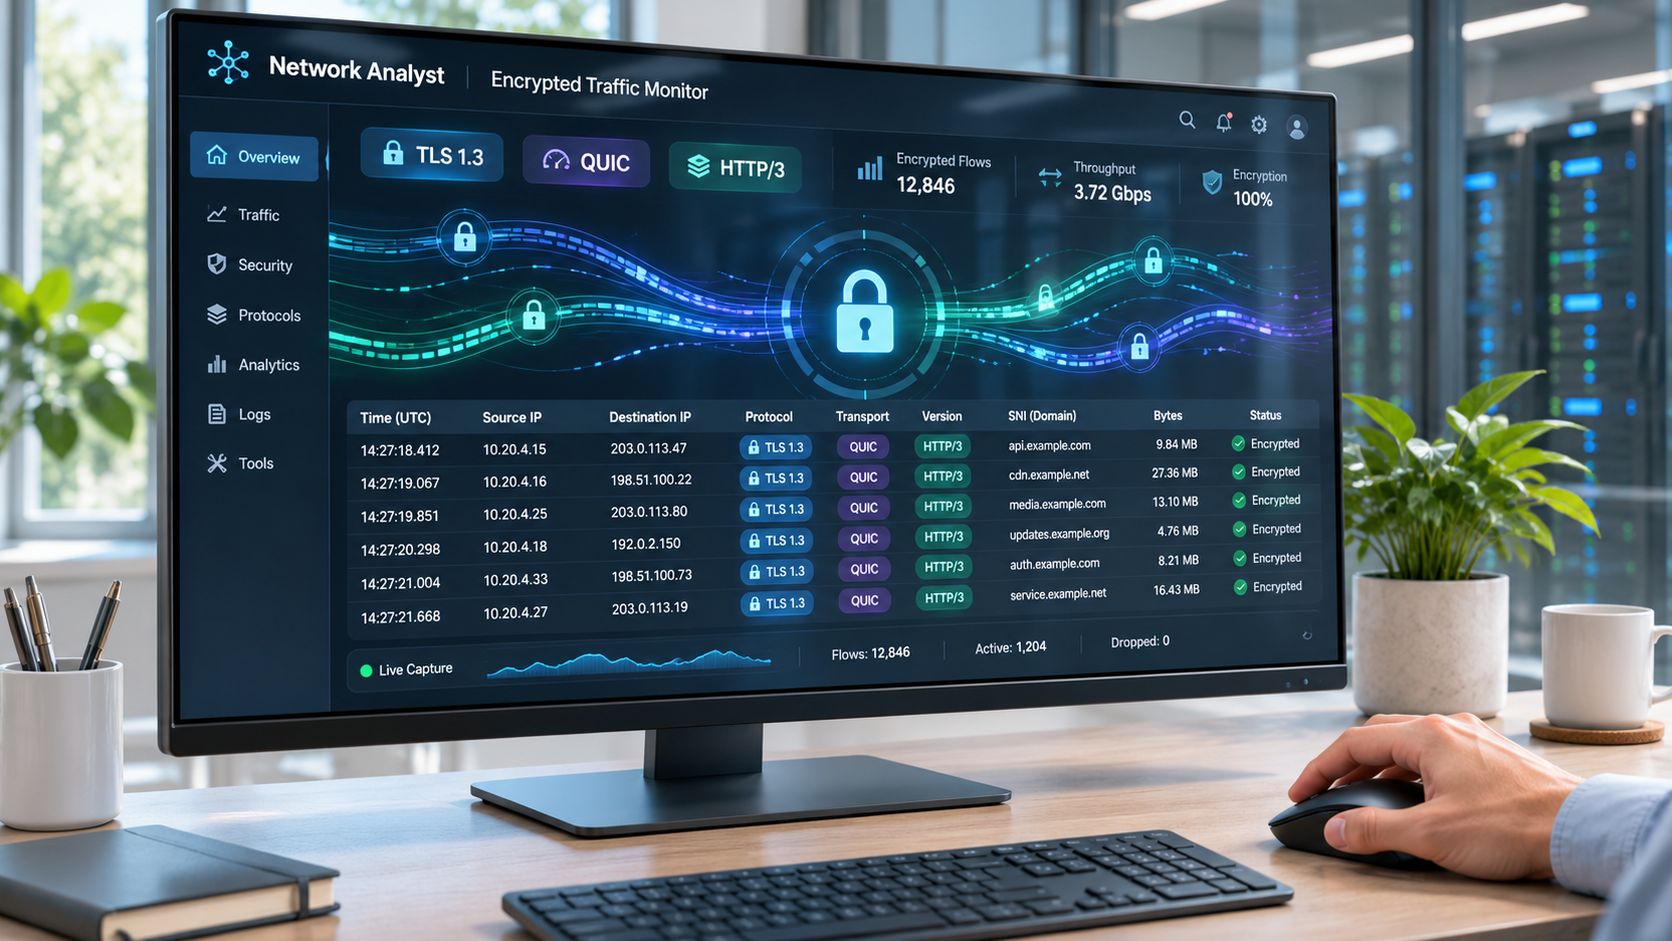
The metadata is more talkative than it looks. Researchers training a model on 500 QUIC-enabled sites identified 70% of monitored websites at 90% precision using DNS packets alone, rising to about 80% recall at 90% precision when DNS-over-QUIC was combined with HTTP/3 traffic (A*STAR research on encrypted traffic). Packet sizes, timing and direction still carry a lot.
What that supports is anomaly detection, application classification and threat triage. What it doesn't support is a claim about what someone read, typed or intended. Make that distinction explicit before anyone promises a manager a report on browsing content.
For a walkthrough of how much survives encryption in a real capture:
Evaluation is where encrypted-traffic work usually falls apart. Split training and test data by complete flow, not by packet, because per-packet splitting leaks near-identical session data into both sets; one recent evaluation dropped to barely 40% accuracy once flow-level separation was applied (evaluation of encrypted traffic classification on arXiv).
Resolver logs are only as good as where DNS terminates. If part of your estate reaches encrypted DNS resolvers and DoH endpoints you don't control, document that gap instead of describing visibility you don't have.
Spotting security and Performance Problems
A host beaconing to a command-and-control domain and a host filling a link look similar from a dashboard. Both create traffic. They need different first checks, and the wrong guess can burn the first hour.
Threats on a network are common enough to plan for. Akamai reported in 2023 that between 10% and 16% of organizations encountered command-and-control traffic on their networks in any given quarter (Akamai research on malicious DNS traffic). Beaconing is built to resemble ordinary browsing, so you find it by pattern rather than by volume.
| Symptom | Likely cause | First check |
|---|---|---|
| Slow browsing at peak times | Link saturation | Utilization by hour against baseline |
| Regular small connections to one unfamiliar domain | Command-and-control beaconing | Connection interval and DNS history for the host |
| Large upload from one host at night | Exfiltration or unscheduled backup | Host's normal outbound volume |
| Spike in NXDOMAIN answers | Malware lookups or resolver fault | Top queried domains and resolver logs |
| Rising retransmissions with normal utilization | Faulty cable or WiFi interference | Error counters and per-AP loss |
| Repeated lookups of one domain by many hosts | Compromised app or misconfigured device | Source hosts and destination reputation |
What beaconing looks like in a flow record
A device contacting one domain at a steady interval, with small and consistent request and response sizes, looks nothing like the same host's daytime pattern. Pull the connection intervals and DNS history for that host before you block anything. A smart TV checking for firmware updates on a fixed schedule will imitate the same shape and waste a day of your week.
Large overnight uploads need context rather than alarm. Compare the host's outbound volume against its own normal, then check whether a backup window moved or a new cloud sync client was installed. The useful question is whether the transfer is unusual for that host, not whether it is large in absolute terms.
Check the block list and threat feed before blaming the network. Record the finding with timestamp, host and destination so the next person can verify it rather than repeat it. That evidence is also what lets you prove what was stopped, instead of arguing from a vague alert.
When the symptom turns out to be congestion rather than compromise, the levers change. DNS-layer ad and tracker blocking can cut web traffic by 20 to 40% and speed up page loads, with no change needed on the devices (Reducing bandwidth usage). That is a practical first check because it reduces demand without touching client configuration, while utilization by hour still shows whether the baseline itself has shifted.
Keeping evidence without Over-Collecting data
More packet data does not automatically buy more security. Full captures raise storage cost, privacy exposure and analyst workload, and they still can't read an encrypted payload. The question worth asking about every record is narrower: does this support containment, safeguarding, an audit, or troubleshooting?
Visibility has a habit of disappearing. When DNS doesn't terminate on enterprise-controlled servers, organizations lose query visibility and pick up blind spots for exfiltration and denial-of-service activity (EfficientIP analysis of DNS infrastructure). That argues for holding resolver evidence under your own control, not for capturing everything.
The defensible minimum set:
- Timestamp and network or SSID, so each record ties to a place and a policy.
- Policy category and action taken, including blocks and the explanation shown to the user.
- Queried domain, threat classification and system health, which is usually enough to reconstruct what happened.
- Not full URLs, payloads or browsing histories, unless there's a clear legal basis and a defined retention period.
Retention is a decision, not a default. Keep summary flow and DNS logs for a set period, keep full captures only while an incident is active, and delete them when the case closes.
Before collection starts: who can read the logs, how long they're kept, and what users were told. If you can't answer all three, you have a storage habit rather than a governance policy.
Where DNS also does the filtering, the reporting layer carries most of the proof. A guide to DNS filtering logs and reporting is worth reading before you design the record format, because retrofitting categories and policy reasons into logs after the fact is painful.
Choose your first monitoring setup
Where you start depends on what you're protecting, and public networks are becoming the default rather than the exception. The Wireless Broadband Alliance reported in 2025 that 46% of respondents planned to deploy city-wide public WiFi in 2025 or 2026, while 15% had already deployed such a network (WBA 2025 industry report).
For a small office, start with flow export from the router, DNS logs and a two-week baseline, then build one dashboard showing link utilization, top talkers and NXDOMAIN share. That single view answers most weekday complaints without anyone opening a capture file.
For a multi-site venue or campus, add per-SSID and per-VLAN views, time-window thresholds, and a DNS-layer log that records each blocked domain with the policy that acted on it. The extra work is in the normalization, not the tooling.
For public or guest WiFi, keep the same per-SSID policy and logging, and tell users plainly what is logged and for how long. Disclosure costs nothing and defuses most complaints before they reach a manager.
Packet capture stays a tool for active incidents, not a permanent feed. Measure the setup by how fast it answers one question: is this slow period capacity, a device fault or a threat?
Purple Shield runs as protective DNS on any WiFi network or on Purple Access networks, with a policy for each, and one network can be protected free for 30 days.
Pick one network this week, capture its busy hour, compare it against the same hour in the baseline, and write down the first finding with its timestamp, host and destination. That single document is worth more than another dashboard.
Purple Shield answers every DNS lookup on the networks it protects, so a domain is checked before a connection opens, and the dashboard shows what was blocked, which threats were stopped, and how the network was used across venues and SSIDs. If you'd rather prove what happened from lookup evidence than run packet capture around the clock, start with the free trial for one network. Visit Purple Shield to see how per-SSID policy and reporting would look on your estate.